Free Access
Fig. 1
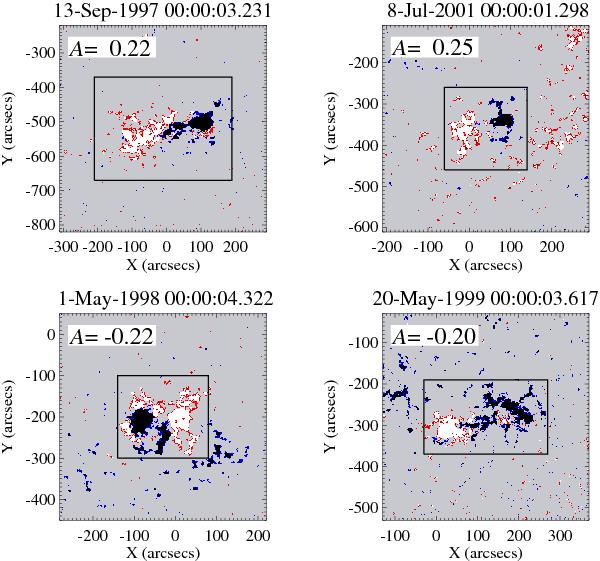
Instances for area asymmetry (A). Red and blue indicate positive and negative polarities, respectively. Rectangles show the areas where morphological parameters are derived. The dynamic range of display is within ±100 G. For emphasis, a region where unsigned field strength is less than 50 G is shown in gray.
Current usage metrics show cumulative count of Article Views (full-text article views including HTML views, PDF and ePub downloads, according to the available data) and Abstracts Views on Vision4Press platform.
Data correspond to usage on the plateform after 2015. The current usage metrics is available 48-96 hours after online publication and is updated daily on week days.
Initial download of the metrics may take a while.