Fig. 9
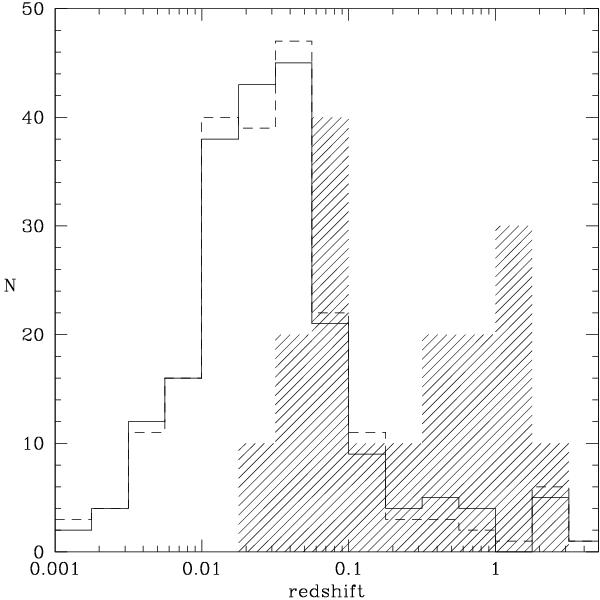
Logarithmic histograms showing the frequency of known AGN redshifts in the surveys of Bird et al. (2010; continuous line) and of Krivonos et al. (2010; dashed line), together with the logarithmic distribution of redshifts of AGNs identified in the present paper (shaded histogram; note that for this latter case the actual numbers are multiplied by 10 for the sake of comparison).
Current usage metrics show cumulative count of Article Views (full-text article views including HTML views, PDF and ePub downloads, according to the available data) and Abstracts Views on Vision4Press platform.
Data correspond to usage on the plateform after 2015. The current usage metrics is available 48-96 hours after online publication and is updated daily on week days.
Initial download of the metrics may take a while.