Fig. 7
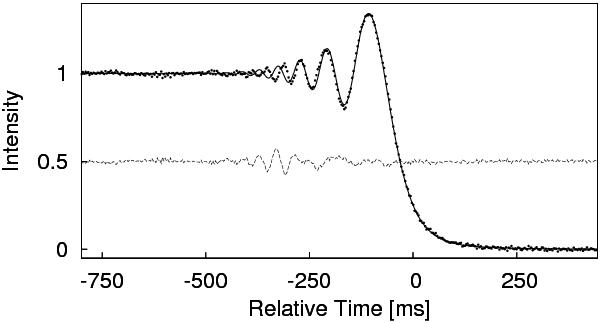
A light curve with variable rate effects: 2MASS 18015464-2529273. The data (dots) have been normalized in intensity and time is counted from the moment of geometrical disappearance. The solid line is the best fit with the fixed-rate light curve of a point source. The dashed line shows the fit residuals, shifted by 0.5 units. More details in the text.
Current usage metrics show cumulative count of Article Views (full-text article views including HTML views, PDF and ePub downloads, according to the available data) and Abstracts Views on Vision4Press platform.
Data correspond to usage on the plateform after 2015. The current usage metrics is available 48-96 hours after online publication and is updated daily on week days.
Initial download of the metrics may take a while.