Fig. 4
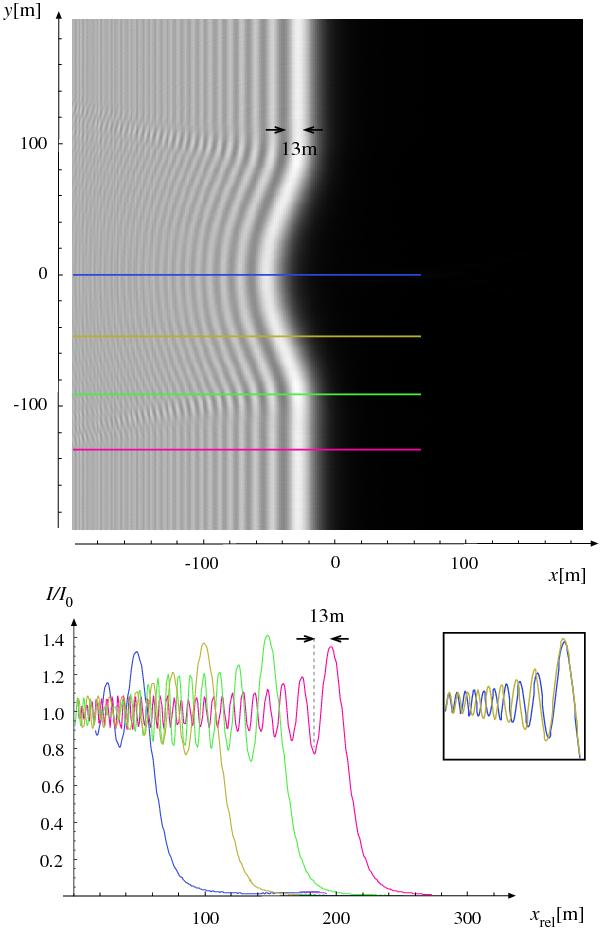
Same as Fig. 3, for a large limb irregularity of about 25 × 200 m (see Fig. 2). The light curves (bottom) are scanned at different locations along the fringe pattern, coded by colours. For clarity, the light curves are shifted with respect to each other. The large irregularity disturbs the ideal pattern by bending it along its profile, modifying the measured fringe spacing as a function of local slope ψ. The inset displays an example of two selected light curves with different fringe spacing taken at y = 0 and at y = −50 m. The local slope ψ at y = −50 m (yellow line) affects the fringe spacing in the same way as the tilted scan in Fig. 3 (also in yellow).
Current usage metrics show cumulative count of Article Views (full-text article views including HTML views, PDF and ePub downloads, according to the available data) and Abstracts Views on Vision4Press platform.
Data correspond to usage on the plateform after 2015. The current usage metrics is available 48-96 hours after online publication and is updated daily on week days.
Initial download of the metrics may take a while.