Fig. B.1
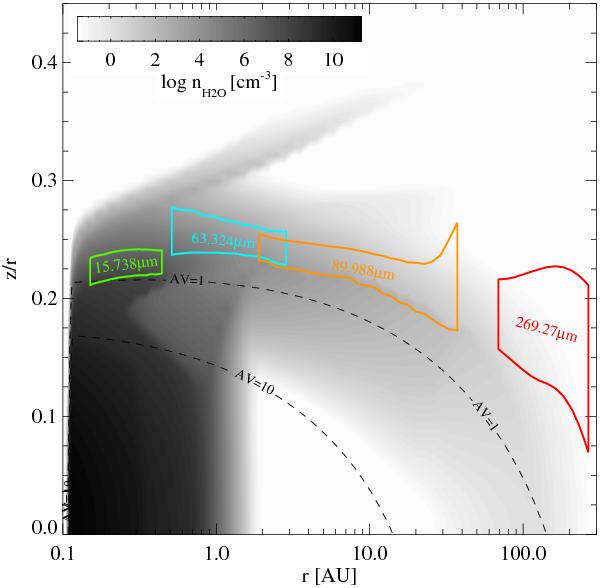
Location of the H2O emission for a typical disc model (M∗ = 0.8 M⊙, L∗ = 0.7 L⊙, Teff = 4400 K, UV excess fUV = 0.01, X-ray luminosity LX = 1030 erg s-1, Rin = 0.1 AU, Rout = 300 AU, Mdisc = 0.01 M⊙, dust/gas = 0.01, ϵ = −1, scale height H0 = 1 AU at r0 = 10 AU, flaring β = 1.1, astronomical silicate with uniform dust size distribution amin = 0.05 μm, amax = 1 mm, and index = 3.5). The 15.738 μm line is used as a typical H2O line detected by Spitzer. We have marked the radii where the cumulative line flux reaches 15% and 85% with vertical lines, for the four selected H2O lines. In addition, the horizontal lines mark the heights above the midplane where 15% and 85% of the line flux, from every vertical column, originate in. The encircled regions are hence responsible for 70% × 70% = 49% of the total line flux (for a pole-on disc).
Current usage metrics show cumulative count of Article Views (full-text article views including HTML views, PDF and ePub downloads, according to the available data) and Abstracts Views on Vision4Press platform.
Data correspond to usage on the plateform after 2015. The current usage metrics is available 48-96 hours after online publication and is updated daily on week days.
Initial download of the metrics may take a while.