Free Access
Fig. 2
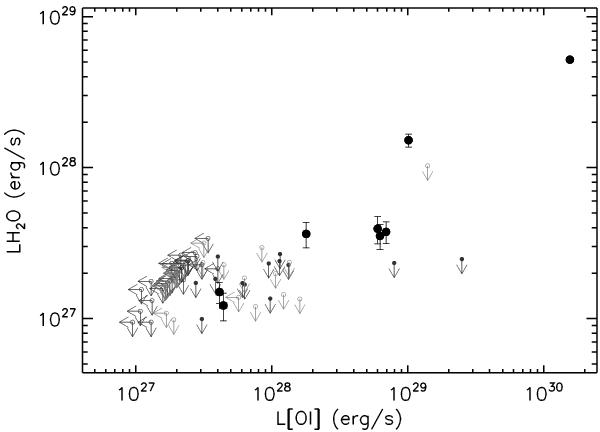
Plot of the 63.32 μm o-H2O line luminosity versus [OI] 63.18 μm. Filled dots are detections, arrows are upper limits. Solid, dark grey arrows represent objects with non-detections spanning the same spectral range as the objects with detections. Light grey, empty arrows represent non-detections with other spectral types.
Current usage metrics show cumulative count of Article Views (full-text article views including HTML views, PDF and ePub downloads, according to the available data) and Abstracts Views on Vision4Press platform.
Data correspond to usage on the plateform after 2015. The current usage metrics is available 48-96 hours after online publication and is updated daily on week days.
Initial download of the metrics may take a while.