Fig. 4
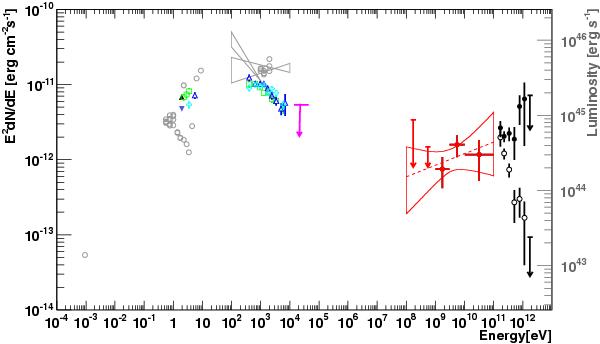
Average SED of 1ES 0414 + 009 from the observations reported in Fig. 3 in the epoch 2005–2009. H.E.S.S.: black filled/open circles with/without EBL correction, respectively. Fermi: red full circles correspond to detections with TS > 9, red downward-pointing arrows to 95% upper limits. Swift/BAT in 5 yrs: magenta 99% upper limit. Swift/XRT&UVOT: green open squares (Oct. 2006), blue open triangles (Jan. 2008), and cyan crosses (Feb. 2008). ATOM: black triangle and blue inverted triangles corresponding to two different states, lower flux level in 2008 and higher in 2006, respectively, in the R and I bands. Gray points and butterflies are a collection of archival data from Costamante & Ghisellini (2002) and references therein.
Current usage metrics show cumulative count of Article Views (full-text article views including HTML views, PDF and ePub downloads, according to the available data) and Abstracts Views on Vision4Press platform.
Data correspond to usage on the plateform after 2015. The current usage metrics is available 48-96 hours after online publication and is updated daily on week days.
Initial download of the metrics may take a while.