Fig. 5
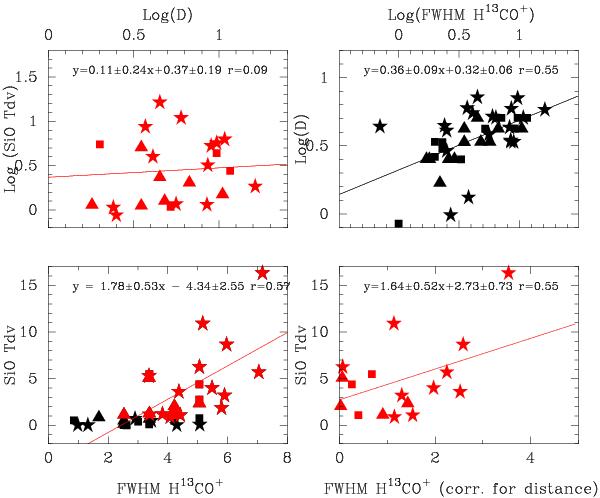
(Bottom left) SiO integrated intensity vs. H13CO+ FWHM and distance. Black symbols in this plot show SiO nondetections, red points indicate detections. The triangles (▴) indicate HMPOs, the filled squares (■) indicate HCHII regions, and the filled stars (★) indicate UCHII regions. The top panels show these two quantities as a function of source distance. The bottom righthand panel shows the SiO integrated intensity vs. H13CO+ FWHM corrected for the size-linewidth relationship.
Current usage metrics show cumulative count of Article Views (full-text article views including HTML views, PDF and ePub downloads, according to the available data) and Abstracts Views on Vision4Press platform.
Data correspond to usage on the plateform after 2015. The current usage metrics is available 48-96 hours after online publication and is updated daily on week days.
Initial download of the metrics may take a while.