Fig. 4
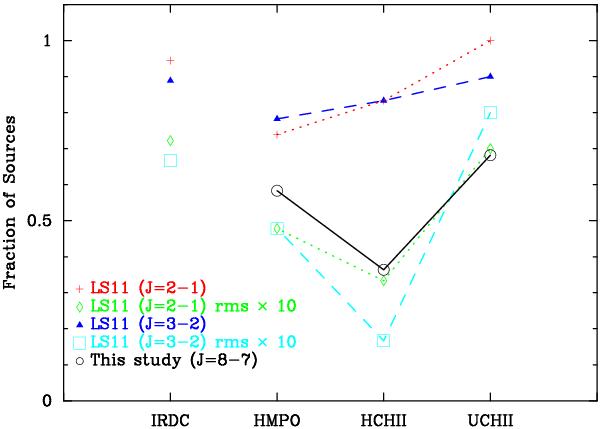
Comparison between the detection rate of SiO presented here with that of López-Sepulcre et al. (2011). The short dashed lines represent their J = 2−1 detections, and the long dashed lines represent their J = 3−2 detections. The ♢ and Λ symbols show the López-Sepulcre et al. (2011) detections corresponding to degrading their sensitivity by a factor of 10 to match our sensitivity. There is a corresponding lack of HCHII region SiO detections in all three tracers. This plot does not consider the differences in beam sizes or excitation conditions required for the 3 different SiO transitions. López-Sepulcre et al. (2011) contained sources at an earlier evolutionary stage than probed here (from the study of Rathborne et al. 2006), and those sources have been included here for completeness.
Current usage metrics show cumulative count of Article Views (full-text article views including HTML views, PDF and ePub downloads, according to the available data) and Abstracts Views on Vision4Press platform.
Data correspond to usage on the plateform after 2015. The current usage metrics is available 48-96 hours after online publication and is updated daily on week days.
Initial download of the metrics may take a while.