Free Access
Fig. 1
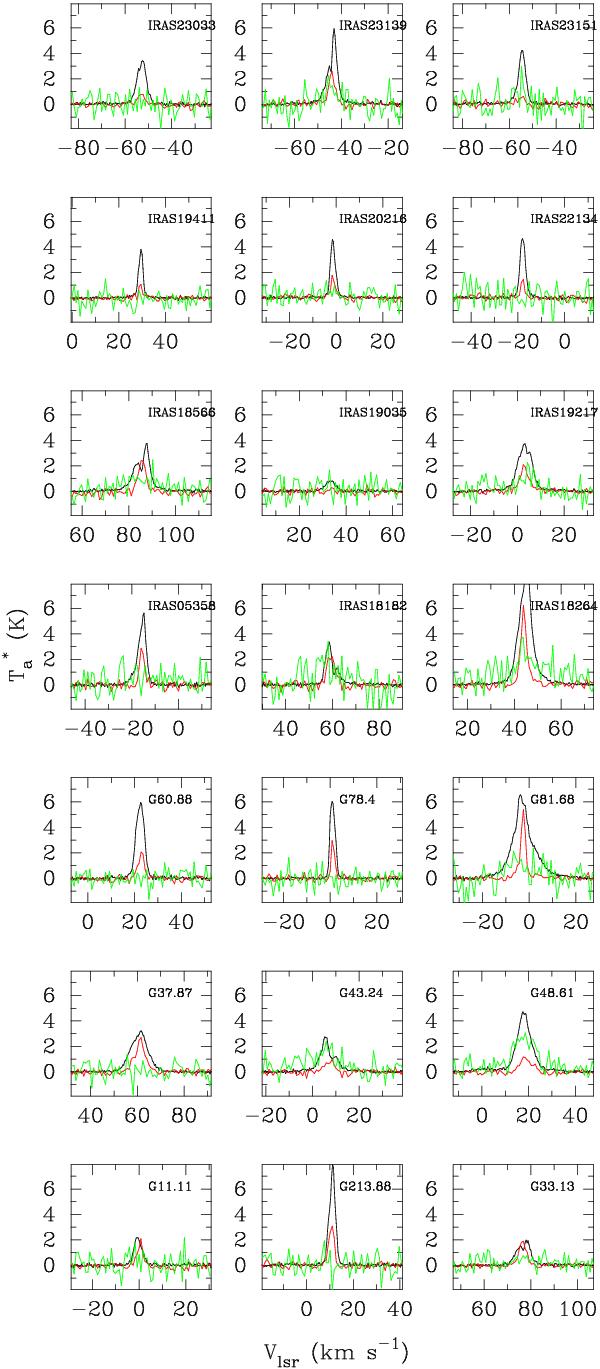
Spectra from new sources. Spectra of previously published sources can be found in Klaassen & Wilson (2007) and Klaassen & Wilson (2008). The scale on the Y axis reflects the intensity of the HCO+ line(black). The H13CO+ (red) has been scaled up by a factor of four, and the SiO (green) has been scaled up by a factor of 16.
Current usage metrics show cumulative count of Article Views (full-text article views including HTML views, PDF and ePub downloads, according to the available data) and Abstracts Views on Vision4Press platform.
Data correspond to usage on the plateform after 2015. The current usage metrics is available 48-96 hours after online publication and is updated daily on week days.
Initial download of the metrics may take a while.