Free Access
Fig. 10
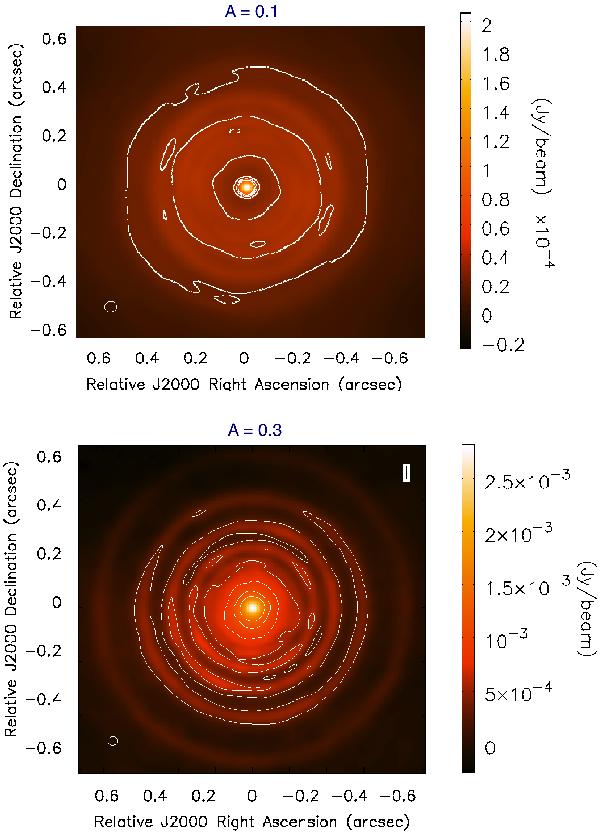
Comparison between the simulated images for an observing wavelength of 1 mm and 2 Myr of evolution, using the full antenna configuration of ALMA for two different values of the amplitude of the perturbation: A = 0.1 (top) and A = 0.3 (bottom). The contour plots are at { 2,4,6,8 } , of the corresponding rms value (Table 2).
Current usage metrics show cumulative count of Article Views (full-text article views including HTML views, PDF and ePub downloads, according to the available data) and Abstracts Views on Vision4Press platform.
Data correspond to usage on the plateform after 2015. The current usage metrics is available 48-96 hours after online publication and is updated daily on week days.
Initial download of the metrics may take a while.