Fig. 8
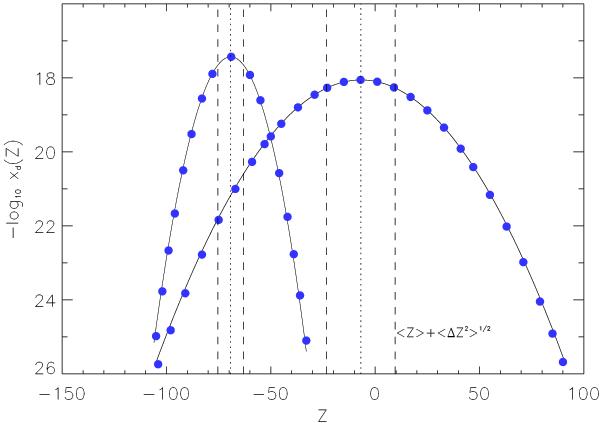
Population Nd(Z) and Nd0(Z) (measured in particle concentration), respectively, vs. charge excess Z evaluated at disc midplane at R = 10 AU. The Gaussian distribution of Nd(Z)/ng with a peak around Z = −8 refers to agglomerates made of N = 106 monomers of size a0 = 10-5 cm while the profile with a peak at Z = −70 is obtained for compact spheres with a∗ = 10-3 cm. The dotted and the dashes lines mark ⟨ Z ⟩ and  , respectively. The solid lines correspond to the values obtained by numerical integration while the values marked by (blue) filled circles are obtained using the semi-analytical solution.
Current usage metrics show cumulative count of Article Views (full-text article views including HTML views, PDF and ePub downloads, according to the available data) and Abstracts Views on Vision4Press platform.
Data correspond to usage on the plateform after 2015. The current usage metrics is available 48-96 hours after online publication and is updated daily on week days.
Initial download of the metrics may take a while.