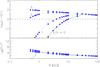
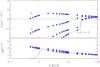
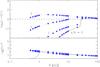
Fig. 7
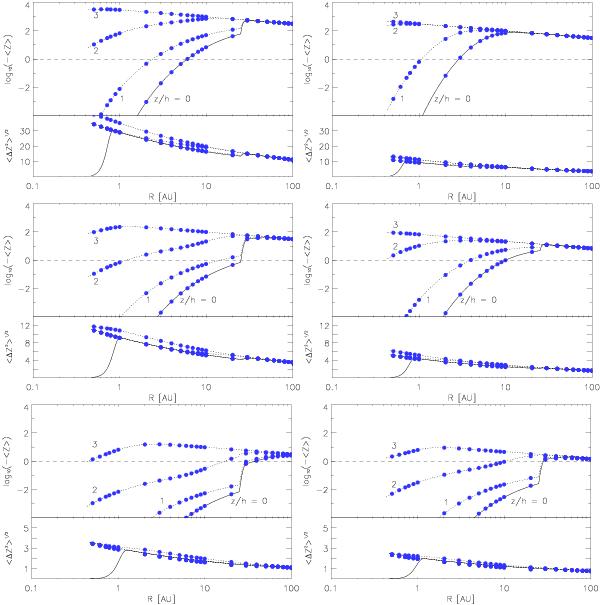
Mean charge ⟨ Z ⟩ and the standard deviation  associated with two different dust topologies as a function of the orbital radius R with |Ṁd| = 10-10 M∗ yr-1. The profiles shown in the left panel refer to BCCA agglomerates with N = 106 (top), N = 104 (middle), and N = 102 (bottom) monomers of a0 = 10-5 cm. The results obtained for the corresponding compact spheres are shown in the right panel. Here, the radius a∗ of the compact sphere varies from a∗ = 10-3 cm (top) to a∗ = 4.64 × 10⁻⁵ cm (bottom) passing a∗ = 2.15 × 10⁻⁴ cm. The lines correspond to the values obtained by numerical integration while the values marked by (blue) filled circles are obtained using the semi-analytical solution.
Current usage metrics show cumulative count of Article Views (full-text article views including HTML views, PDF and ePub downloads, according to the available data) and Abstracts Views on Vision4Press platform.
Data correspond to usage on the plateform after 2015. The current usage metrics is available 48-96 hours after online publication and is updated daily on week days.
Initial download of the metrics may take a while.