Fig. 4
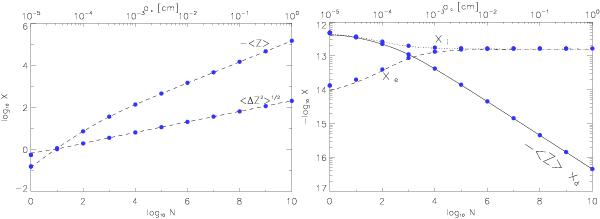
Mean charge ⟨ Z ⟩ of dust agglomerates and the standard deviation  as a function of the number of constituent monomers N (left panel). The upper abscissa relates N to the characteristic radius ac of the BCCA agglomerate. The electron fraction xe, the ion concentration xi (with M+ as the dominant ion) and the mean charge of the dust ⟨ Z ⟩ per dust agglomerate are shown at the right panel using solid, dashed, and dotted lines. The profiles shown are obtained at R = 10 AU and z/hg = 0 applying the “reduced” network of the modified Oppenheimer-Dalgarno model with adsorption and desorption process switched off. DBCCA = 2. The lines correspond to the values obtained by numerical integration while the values marked by (blue) filled circles are obtained using the semi-analytical solution.
Current usage metrics show cumulative count of Article Views (full-text article views including HTML views, PDF and ePub downloads, according to the available data) and Abstracts Views on Vision4Press platform.
Data correspond to usage on the plateform after 2015. The current usage metrics is available 48-96 hours after online publication and is updated daily on week days.
Initial download of the metrics may take a while.