Free Access
Fig. 2
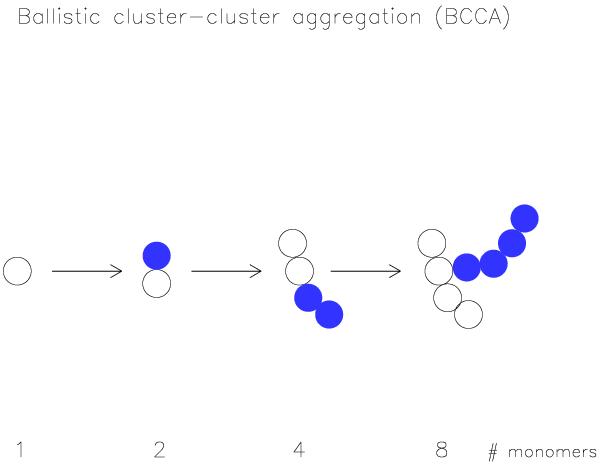
Scheme representing the dust growth characterised as ballistic cluster-cluster aggregation. The agglomerates collide with a clone of each as marked with filled circles. The figure is adopted from Okuzumi et al. (2009).
Current usage metrics show cumulative count of Article Views (full-text article views including HTML views, PDF and ePub downloads, according to the available data) and Abstracts Views on Vision4Press platform.
Data correspond to usage on the plateform after 2015. The current usage metrics is available 48-96 hours after online publication and is updated daily on week days.
Initial download of the metrics may take a while.