Fig. A.2
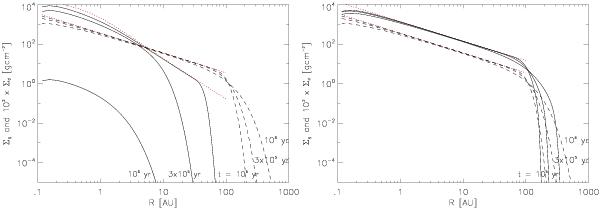
Radial profile of the surface densities of the gas and the dust at different time snaps t = 105,3 × 10⁵ and 106 yr. The solid lines correspond to the dust surface density while the gas surface density is shown using the dashed lines. The (red-coloured) dotted line refers to Σg ~ R-1 and Σd = Ṁd/(2πR ⟨ vR,d ⟩ ) at t/tK = 0. |Ṁd| = 10-10 M⊙/yr, α = 10-3, and ϱp = 1.0 g cm-3. The profiles shown in the left panel are obtained under the assumption of spherical grains with a0 = 1 mm. The corresponding profiles obtained for agglomerates with DBCCA = 2 and N = 1012 monomers of a0 = 10-5 cm are shown in the right panel.
Current usage metrics show cumulative count of Article Views (full-text article views including HTML views, PDF and ePub downloads, according to the available data) and Abstracts Views on Vision4Press platform.
Data correspond to usage on the plateform after 2015. The current usage metrics is available 48-96 hours after online publication and is updated daily on week days.
Initial download of the metrics may take a while.