Fig. A.1
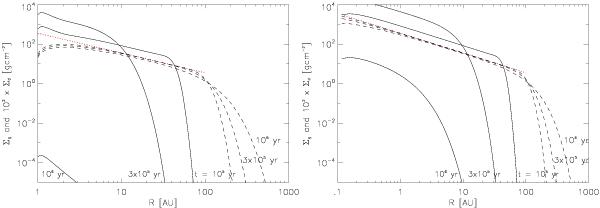
Radial profile of the surface densities of the gas and the dust particles at different time snaps t = 105,3 × 10⁵ and 106 yr with a0 = 1 mm and ϱp = 1.0 g cm-3. The parameter are α = 10-3 and Σd/Σg = 10-2 at t/tK = 0. The solid lines correspond to the dust surface density while the gas surface density is shown using the dashed lines. The dotted line refers to Σg ~ R-1 at t/tν = 0. The profiles shown in the left panel are obtained using the boundary conditions of Takeuchi & Lin (2005). Moving the inner boundary to smaller R and applying an analytical prescription for Σg at the inner and outer boundary cause the profiles to change as shown in the right panel.
Current usage metrics show cumulative count of Article Views (full-text article views including HTML views, PDF and ePub downloads, according to the available data) and Abstracts Views on Vision4Press platform.
Data correspond to usage on the plateform after 2015. The current usage metrics is available 48-96 hours after online publication and is updated daily on week days.
Initial download of the metrics may take a while.