Fig. 4
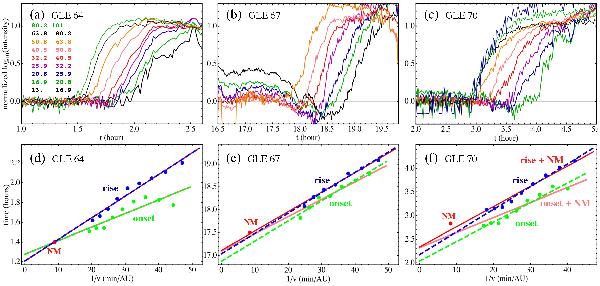
Example of the RPM and VDA analysis. Top row: normalized time profile of the logarithm of the intensity during the rising phase without any time shift for GLEs 64, 67 and 70, respectively, in panels a)–c) (see Sect. 3.1). The energy range (in MeV) of channels is added on the panel a). Bottom row, panels d)–f): plots of rise and onset times in function of the inverse of the proton velocity. The dark gray (or blue) points correspond to the rise times determined by RPM apply to ERNE data (Sect. 3.1), and the related linear fit is displayed by a dashed line (dark gray or blue). The linear fit related to the data set including the NM point (labeled and plotted in black or red), in addition to the previous ERNE points, is represented by a continuous line (black or red). The medium gray (or green) points correspond to the onset times of ERNE data and the related linear fit is displayed with a dashed line and the same color. The linear fit with the NM point added is shown with a continuous line and light gray (or pink). A color version is available in the electronic version.
Current usage metrics show cumulative count of Article Views (full-text article views including HTML views, PDF and ePub downloads, according to the available data) and Abstracts Views on Vision4Press platform.
Data correspond to usage on the plateform after 2015. The current usage metrics is available 48-96 hours after online publication and is updated daily on week days.
Initial download of the metrics may take a while.