Fig. 1
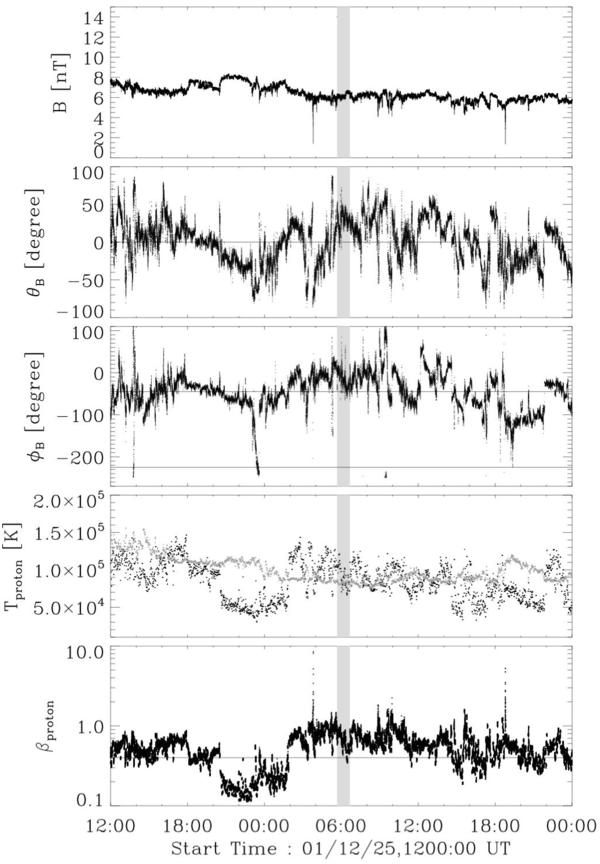
Interplanetary data around GLE 63 (Dec. 26, 2001): example of a GLE present in a typical Parker spiral. From top to bottom, panels display the magnitude of the magnetic field (nT); its latitude θB and its longitude φB (given in GSE coordinate system); then on the same panel are overplotted the temperature of protons measured by the spacecraft (black dots) and the expected temperature (gray dots), and finally the β of protons. A horizontal line is added for θB = 0, φB = −45° and βproton = 0.4 to mark characteristic values. The grayscale rectangle in the five panels corresponds to the 1-hour time interval starting at the first arrival time of relativistic protons at Earth. The time axis is as measured at Earth. The ACE measurements at the L1 Lagrangian point were shifted by the appropriate travel time (see Sect. 2.2).
Current usage metrics show cumulative count of Article Views (full-text article views including HTML views, PDF and ePub downloads, according to the available data) and Abstracts Views on Vision4Press platform.
Data correspond to usage on the plateform after 2015. The current usage metrics is available 48-96 hours after online publication and is updated daily on week days.
Initial download of the metrics may take a while.