Fig. 4
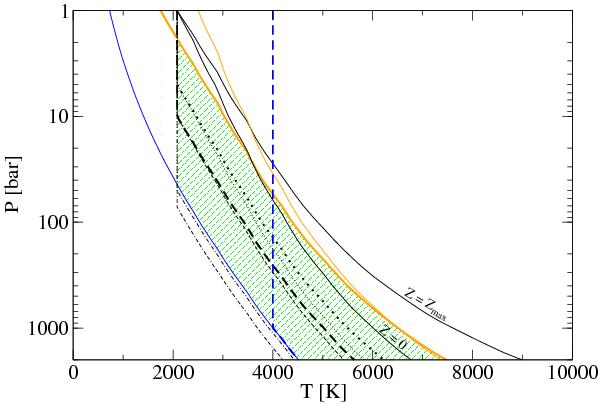
P − T profiles near the atmosphere of acceptable and unacceptable models. Colors and line styles are the same as in Figs. 2 and 3. For lines with same color and style, models with Z = 0 and Z = Zmax are shown. Thick lines indicate acceptable models; compare these also to Fig. 3. The green shaded area marks the P − T regime for acceptable models. However, models in this regime are only acceptable when they also have a large enough amount of metals in their envelopes.
Current usage metrics show cumulative count of Article Views (full-text article views including HTML views, PDF and ePub downloads, according to the available data) and Abstracts Views on Vision4Press platform.
Data correspond to usage on the plateform after 2015. The current usage metrics is available 48-96 hours after online publication and is updated daily on week days.
Initial download of the metrics may take a while.