Fig. 1
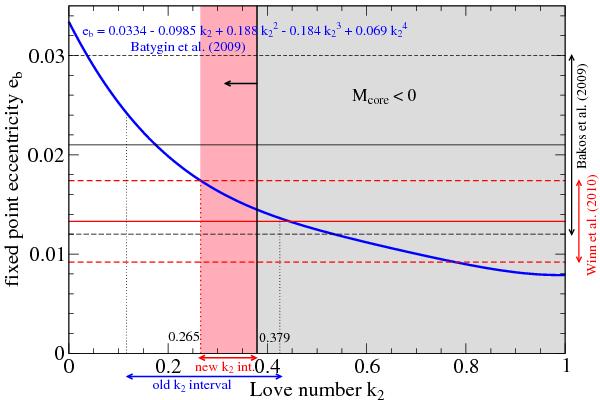
Relation between the fixed point eccentricity eb and the Love number k2. The blue line shows the fourth order polynomial fit from Batygin et al. (2009). Different eccentricity measurements from Bakos et al. (2009) and Winn et al. (2010) are plotted in black and red, respectively, with solid lines showing the mean value of the measured eccentricity and dashed lines showing the error bars. The black dotted lines indicate the k2 interval inferred from Batygin et al. (2009) based on the eccentricity measurement from Bakos et al. (2009), in the figure also referred to as old k2 interval. The gray shaded area marks a region of k2 values not possible for models of HAT-P-13b. The vertical black solid line (Mcore = 0) shows the maximum possible k2 value we found based on our interior modeling (see Sect. 4 for details). Combining the information of the eb − k2-relation from Batygin et al. (2009), the new eccentricity measurement from Winn et al. (2010), and our interior modeling, we find a new k2 interval ranging from 0.265 − 0.379 (rosy shaded).
Current usage metrics show cumulative count of Article Views (full-text article views including HTML views, PDF and ePub downloads, according to the available data) and Abstracts Views on Vision4Press platform.
Data correspond to usage on the plateform after 2015. The current usage metrics is available 48-96 hours after online publication and is updated daily on week days.
Initial download of the metrics may take a while.