Free Access
Fig. 6
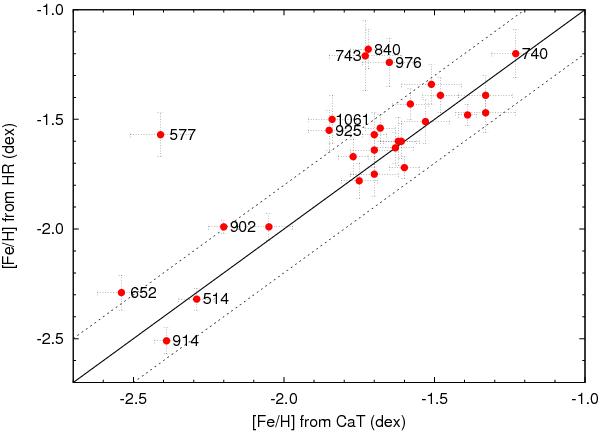
For our sample of RGB stars in the Carina dSph, we show the comparison between [Fe/H] measured from our high resolution spectroscopy and from the CaT (Starkenburg et al. 2010). The solid line indicates where [Fe/H]CaT = [Fe/H]HR while the dashed lines indicate an uncertainty of ± 0.2 dex.
Current usage metrics show cumulative count of Article Views (full-text article views including HTML views, PDF and ePub downloads, according to the available data) and Abstracts Views on Vision4Press platform.
Data correspond to usage on the plateform after 2015. The current usage metrics is available 48-96 hours after online publication and is updated daily on week days.
Initial download of the metrics may take a while.