Fig. 3
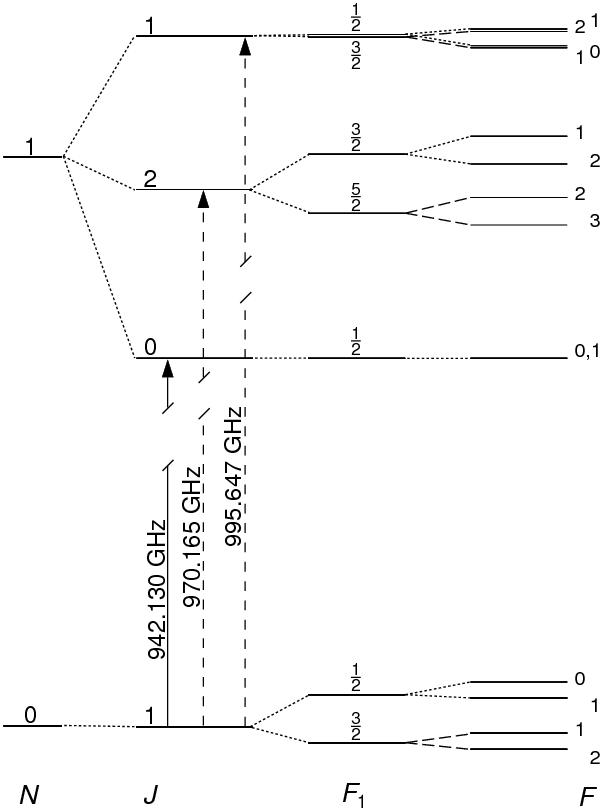
Schematic energy-level diagram showing the fine- (J) and hyperfine-structure (F1, F) splittings of the N = 1 ← 0 rotational transition of 15NH. Hyperfine level splittings shown are a hundred times the actual ones for clarity. The lower fine-structure component (J = 0 ← 1) occurring near 942.130 GHz recorded at PhLAM laboratory with partly resolved hyperfine-structure (see Fig. 4) is indicated by a solid line.
Current usage metrics show cumulative count of Article Views (full-text article views including HTML views, PDF and ePub downloads, according to the available data) and Abstracts Views on Vision4Press platform.
Data correspond to usage on the plateform after 2015. The current usage metrics is available 48-96 hours after online publication and is updated daily on week days.
Initial download of the metrics may take a while.