Free Access
Fig. 8
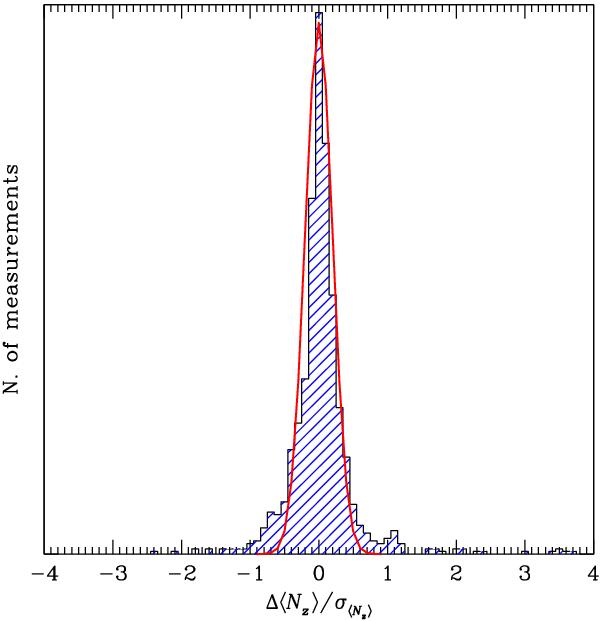
The distribution of the differences between the null field values measured after flexure simulation and their original values, normalised to the error bars, compared to a Gaussian curve centred about zero and with σ = 0.2. Null field values were calculated from the H Balmer lines.
Current usage metrics show cumulative count of Article Views (full-text article views including HTML views, PDF and ePub downloads, according to the available data) and Abstracts Views on Vision4Press platform.
Data correspond to usage on the plateform after 2015. The current usage metrics is available 48-96 hours after online publication and is updated daily on week days.
Initial download of the metrics may take a while.