Free Access
Fig. 7
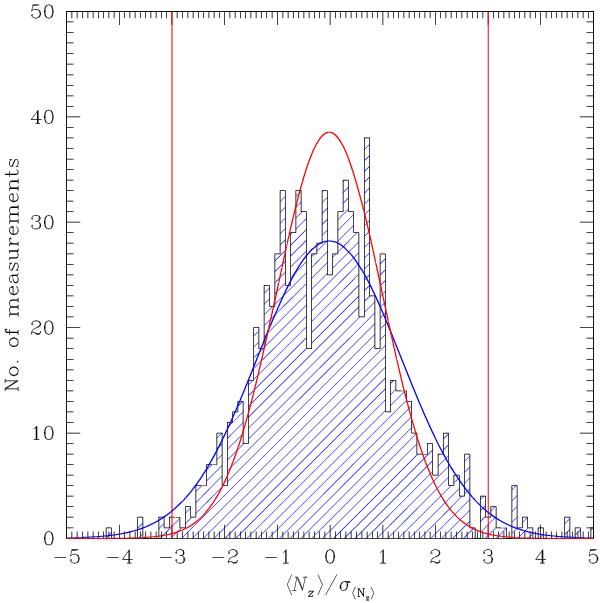
Histogram of the ⟨ Nz ⟩ values calculated from Balmer lines, and normalised to the error bars σ ⟨ Nz ⟩ . The red solid lines show the Gaussian with σ = 1, and the blue solid line a Gaussian with σ = 1.365, both with the same areas as the observed distribution. The vertical lines mark the limits at − 3 and 3.
Current usage metrics show cumulative count of Article Views (full-text article views including HTML views, PDF and ePub downloads, according to the available data) and Abstracts Views on Vision4Press platform.
Data correspond to usage on the plateform after 2015. The current usage metrics is available 48-96 hours after online publication and is updated daily on week days.
Initial download of the metrics may take a while.