Fig. 2
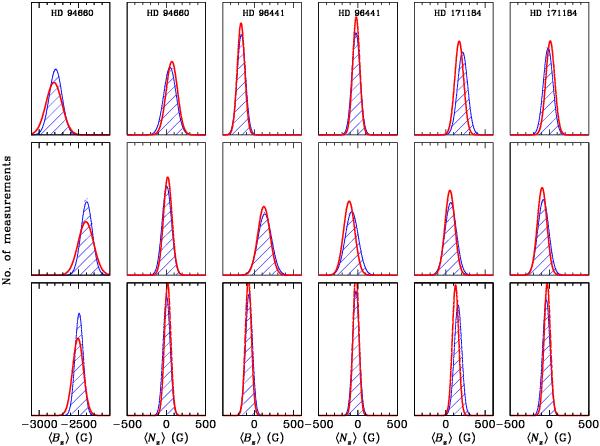
Results obtained from the analysis of the H Balmer lines (top panels), of the metal lines (mid panels), and of the full spectrum (bottom panels) for three stars, using standard error theory and Montecarlo simulations. The (red) thick solid lines are Gaussian curves centred about the various field values and with σ given by Eq. (11). The blue lines show the distributions obtained with Monte Carlo simulations as explained in the text. Note that HD 94660 has a large field, HD 96441 has no detected field, and HD 171184 has a weak but probably real field.
Current usage metrics show cumulative count of Article Views (full-text article views including HTML views, PDF and ePub downloads, according to the available data) and Abstracts Views on Vision4Press platform.
Data correspond to usage on the plateform after 2015. The current usage metrics is available 48-96 hours after online publication and is updated daily on week days.
Initial download of the metrics may take a while.