Fig. 1
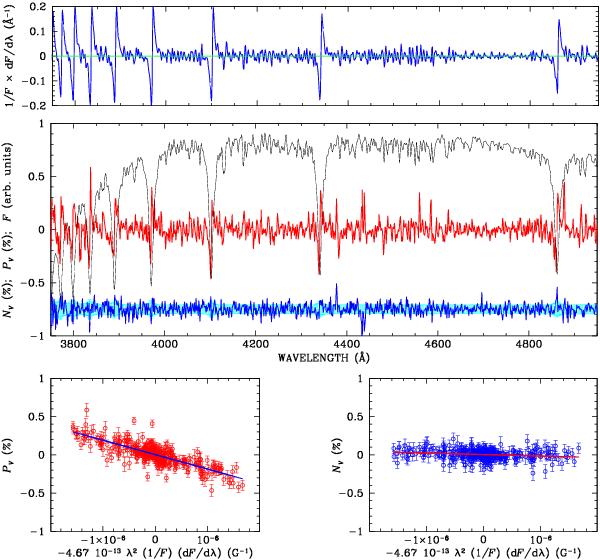
The polarised spectrum of HD 94660 observed on 2007-03-22 with grism 600B. The top panel shows the normalised derivative of the observed flux, and the panel immediately below shows the observed flux F (black solid line, in arbitrary units, and not corrected for the instrument response), the PV profile (red solid line centred about 0), and the null profile (blue solid line, offset by –0.75% for display purpose). The null profile is expected to be centred about zero and scattered according to a Gaussian with σ given by the PV error bars. The PV error bars are represented with light blue bars centred about –0.75%. The slope of the interpolating lines in the bottom panels gives the mean longitudinal field from PV (left bottom panel) and from the null profile (right bottom panel) both calculated using the H Balmer lines only. The corresponding ⟨ Bz ⟩ and ⟨ Nz ⟩ values are − 1885 ± 90 G and − 192 ± 62 G, respectively.
Current usage metrics show cumulative count of Article Views (full-text article views including HTML views, PDF and ePub downloads, according to the available data) and Abstracts Views on Vision4Press platform.
Data correspond to usage on the plateform after 2015. The current usage metrics is available 48-96 hours after online publication and is updated daily on week days.
Initial download of the metrics may take a while.