Fig. 8
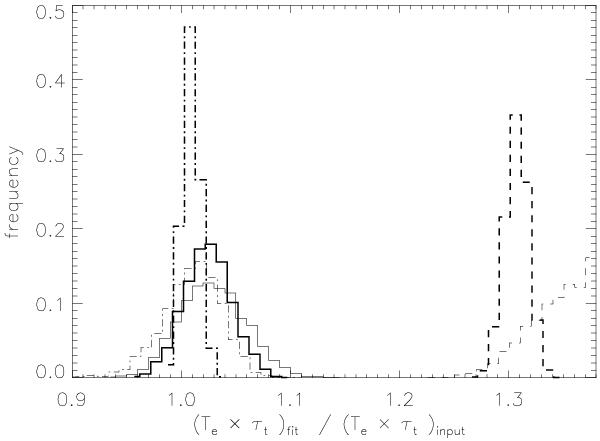
Histograms of the best-fit Te × τt normalized to the input of the simulation, for EC0 with three parameter fits (dashed lines), EC0 with four parameter fits (continuous lines) and EC1 with four parameter fit (dot-dashed lines). Thin lines are for a Gaussian prior on Te centred on the input value of Te and with a standard deviation of 8 keV; thick lines are for a standard deviation of 3 keV.
Current usage metrics show cumulative count of Article Views (full-text article views including HTML views, PDF and ePub downloads, according to the available data) and Abstracts Views on Vision4Press platform.
Data correspond to usage on the plateform after 2015. The current usage metrics is available 48-96 hours after online publication and is updated daily on week days.
Initial download of the metrics may take a while.