Fig. 3
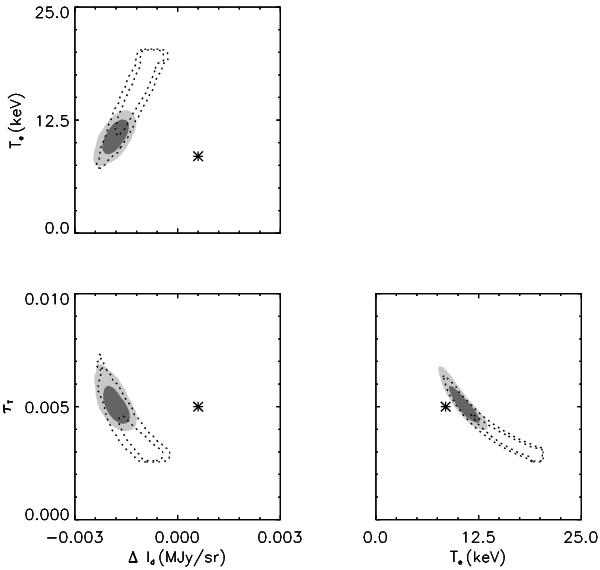
Joint likelihood contours (95.6% and 68.7%) for couples of best-fit parameters for the experimental configuration EC0 (ground based observations with a 4-band photometer) where the data are analysed by fitting the three parameters τt, Te, ΔId. The filled contours are for a Gaussian prior on Te with σ = 3 keV; the dashed contours are for a Gaussian prior with σ = 8 keV. The * symbols mark the input values of parameters. In this case a significant bias for all parameters is evident. The anti-correlation between τt and Te is also evident.
Current usage metrics show cumulative count of Article Views (full-text article views including HTML views, PDF and ePub downloads, according to the available data) and Abstracts Views on Vision4Press platform.
Data correspond to usage on the plateform after 2015. The current usage metrics is available 48-96 hours after online publication and is updated daily on week days.
Initial download of the metrics may take a while.