Fig. 1
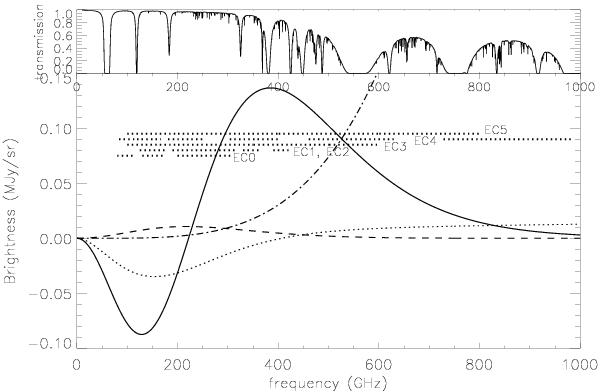
Thermal SZ spectrum (continuous line in bottom panel), compared to the atmospheric transmission of a dry, cold, atmosphere (top panel, PWV = 0.5 mm), and to spectra of the non-thermal SZ effect (dotted line), of CMB anisotropy and kinematic SZ (dashed line), and of dust anisotropy (dot-dashed line). The parameters of the different spectra are for the benchmark case detailed in Sect. 2: τt = 5 × 10⁻³, Te = 8.5 keV, ΔTCMB = 22 μK, τnt = 1 × 10⁻⁴, α = −2.7, p1 = 1.4 MeV/c, ΔId(150 GHz) = 600 Jy. The frequency coverage of the different experiments considered in the paper is also shown as dotted horizontal lines, labelled with the experimental configuration number.
Current usage metrics show cumulative count of Article Views (full-text article views including HTML views, PDF and ePub downloads, according to the available data) and Abstracts Views on Vision4Press platform.
Data correspond to usage on the plateform after 2015. The current usage metrics is available 48-96 hours after online publication and is updated daily on week days.
Initial download of the metrics may take a while.