Fig. 1
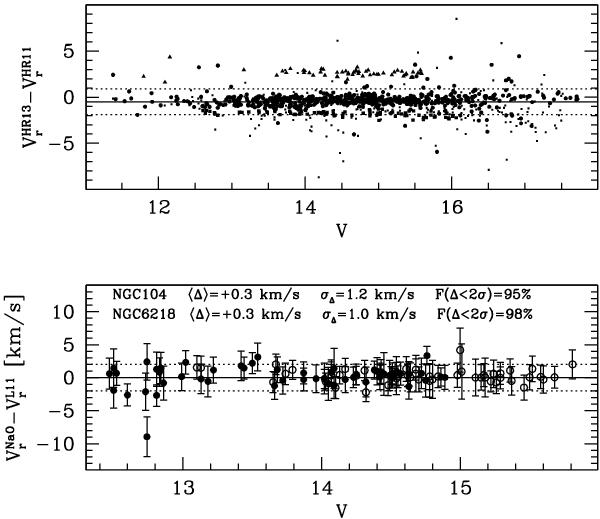
Upper panel: comparison between RVs estimated from spectra obtained with the HR13 and HR11 grisms. Different symbols correspond to different clusters. The continuous line is drawn at a typical value for the mean difference (ΔVr = −0.5 km s-1), and the dotted lines enclose the ± 2σ range about the mean, where a typical value of σ = 0.7 km s-1 has been adopted (see Table 1). Lower panel: comparison with the external dataset by L11 for two representative clusters, NGC 104 (filled circles) and NGC 6218 (empty circles). The continuous line marks ΔVr = 0.0 km s-1, the dotted lines enclose the ± 2σ range. The fraction of stars lying within ± 2σ is also reported [F(Δ < 2σ)].
Current usage metrics show cumulative count of Article Views (full-text article views including HTML views, PDF and ePub downloads, according to the available data) and Abstracts Views on Vision4Press platform.
Data correspond to usage on the plateform after 2015. The current usage metrics is available 48-96 hours after online publication and is updated daily on week days.
Initial download of the metrics may take a while.