Fig. 8
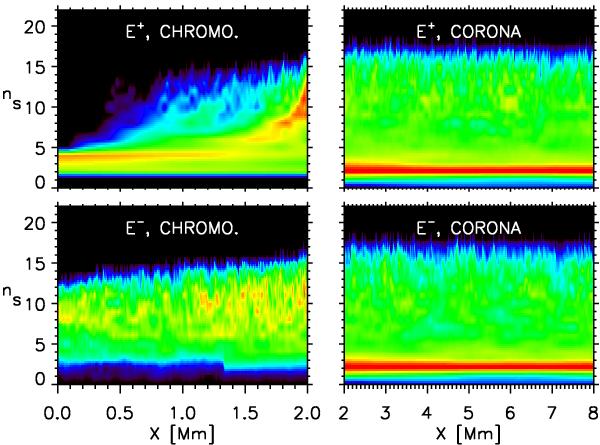
Run D. Contour plot of the spectra E±(x,kn) (snapshots) for z+ and z− (top and bottom panels, respectively) compensated for k5/3 in the chromosphere (left panels) and in the corona (right panels). Ordinate: shell number ns = log 2(kn/k0). Abscissa: coordinate x along the loop in Mm. The contours have different ranges in the chromospheric and coronal layers to highlight their structures better.
Current usage metrics show cumulative count of Article Views (full-text article views including HTML views, PDF and ePub downloads, according to the available data) and Abstracts Views on Vision4Press platform.
Data correspond to usage on the plateform after 2015. The current usage metrics is available 48-96 hours after online publication and is updated daily on week days.
Initial download of the metrics may take a while.