Fig. 7
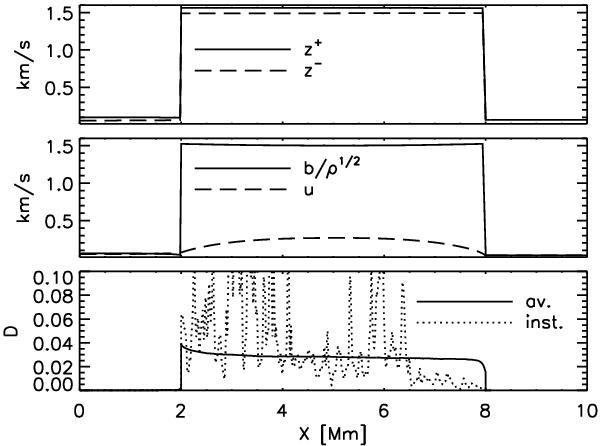
Run D (three-layer open model, weak turbulence case): spatial distributions of
fluctuations (top and mid panels) and turbulent heating
(bottom panel). The time-averaged rms amplitude (in
km s-1) are plotted as a function of loop coordinate (in Mm) for
z+, z−
(top panel, solid and dashed lines, respectively) and for
b/ (bottom panel, solid and dashed lines, respectively). The
time-averaged heating rate (in arbitrary units) is plotted in the bottom
panel as a solid line, and a snapshot is shown in dotted line.
(bottom panel, solid and dashed lines, respectively). The
time-averaged heating rate (in arbitrary units) is plotted in the bottom
panel as a solid line, and a snapshot is shown in dotted line.
Current usage metrics show cumulative count of Article Views (full-text article views including HTML views, PDF and ePub downloads, according to the available data) and Abstracts Views on Vision4Press platform.
Data correspond to usage on the plateform after 2015. The current usage metrics is available 48-96 hours after online publication and is updated daily on week days.
Initial download of the metrics may take a while.