Fig. 5
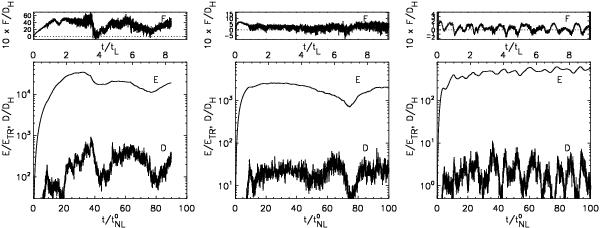
From left to right: Run Dcl (closed model), Run D1L
(one-layer model), and Run D (three-layer model). For all the runs
χ0 ≈ 0.2, for the one-layer and three-layer models
χL ≈ 11. Top panels:
time evolution of the net energy flux F. Bottom
panels: time evolution of the coronal energy (E) and
dissipation below (D). Time is normalized to the input nonlinear
timescale  , energy
is normalized to the injection energy at the left boundary
, energy
is normalized to the injection energy at the left boundary
 ,
dissipation and flux are normalized to Hollweg expression
,
dissipation and flux are normalized to Hollweg expression
 .
.
Current usage metrics show cumulative count of Article Views (full-text article views including HTML views, PDF and ePub downloads, according to the available data) and Abstracts Views on Vision4Press platform.
Data correspond to usage on the plateform after 2015. The current usage metrics is available 48-96 hours after online publication and is updated daily on week days.
Initial download of the metrics may take a while.