Fig. 4
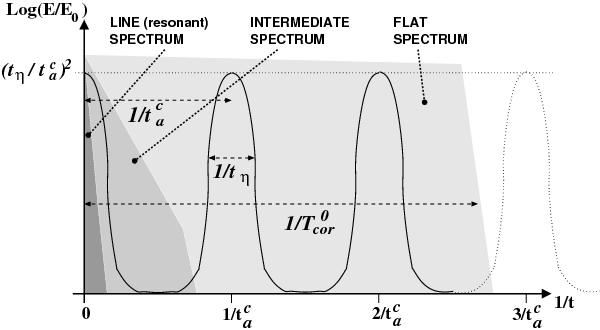
Sketch of the linear coronal energy gain,
log (E/E0) as a
function of frequency. E0 is the input photospheric
energy at each frequency. It is assumed that  , and only the
non-wkb portion of the spectrum is shown. The injected spectrum is also indicated as
a shaded areas on an arbitrary scale, for the case of flat, intermediate, and line
spectra (in increasing gray-scale order).
, and only the
non-wkb portion of the spectrum is shown. The injected spectrum is also indicated as
a shaded areas on an arbitrary scale, for the case of flat, intermediate, and line
spectra (in increasing gray-scale order).
Current usage metrics show cumulative count of Article Views (full-text article views including HTML views, PDF and ePub downloads, according to the available data) and Abstracts Views on Vision4Press platform.
Data correspond to usage on the plateform after 2015. The current usage metrics is available 48-96 hours after online publication and is updated daily on week days.
Initial download of the metrics may take a while.