Fig. 10
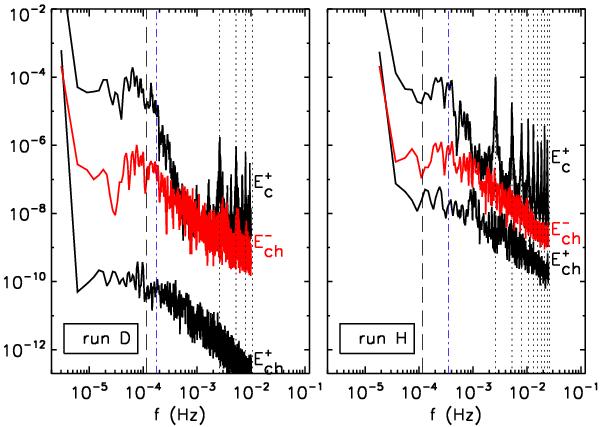
Runs D and H (weak and strong
χ0): frequency energy spectra
E+(f), E−(f),
computed by taking the Fourier transform of the
 at each
plane and then space averaging separately in the chromosphere (bottom black and red
lines) and corona (top black line). The E− (not
plotted) and E+ coronal spectra are indistinguishable.
The vertical lines mark some relevant timescales: dotted lines for the resonances at
n ≥ 1; dot-dashed lines for the (round-trip) chromospheric
crossing time,
at each
plane and then space averaging separately in the chromosphere (bottom black and red
lines) and corona (top black line). The E− (not
plotted) and E+ coronal spectra are indistinguishable.
The vertical lines mark some relevant timescales: dotted lines for the resonances at
n ≥ 1; dot-dashed lines for the (round-trip) chromospheric
crossing time,  ; and
long-dashed lines for the leakage time,
tL.
; and
long-dashed lines for the leakage time,
tL.
Current usage metrics show cumulative count of Article Views (full-text article views including HTML views, PDF and ePub downloads, according to the available data) and Abstracts Views on Vision4Press platform.
Data correspond to usage on the plateform after 2015. The current usage metrics is available 48-96 hours after online publication and is updated daily on week days.
Initial download of the metrics may take a while.