Fig. 2
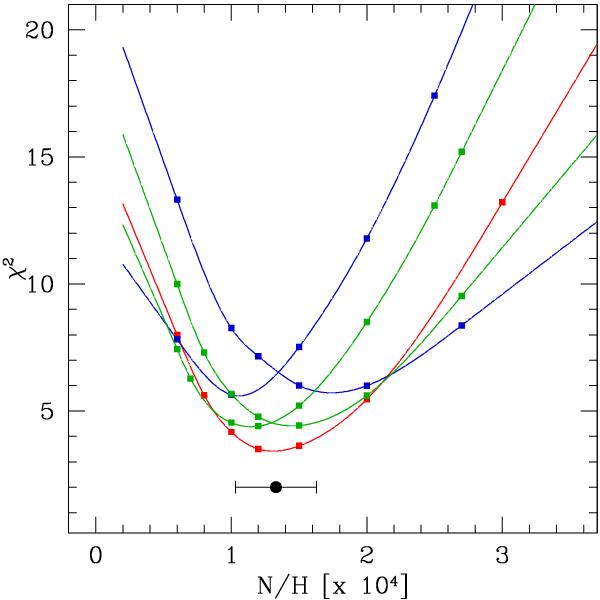
Chi squares computed for HD 57682 as a function of the nitrogen abundance. Each color represents a parameter set: red for the best fit model (parameters given in Table 2), green for variations of the surface gravity (±0.1 dex with respect to the best fit model) and finally, blue for variations of the effective temperature (± 1000 K with respect to the best fit model). The symbols correspond to the models computed. The different curves are polynomial fits to the respective set of symbols. The black dot with the error bars shows the position of the final N/H value and its uncertainty.
Current usage metrics show cumulative count of Article Views (full-text article views including HTML views, PDF and ePub downloads, according to the available data) and Abstracts Views on Vision4Press platform.
Data correspond to usage on the plateform after 2015. The current usage metrics is available 48-96 hours after online publication and is updated daily on week days.
Initial download of the metrics may take a while.