Fig. 1
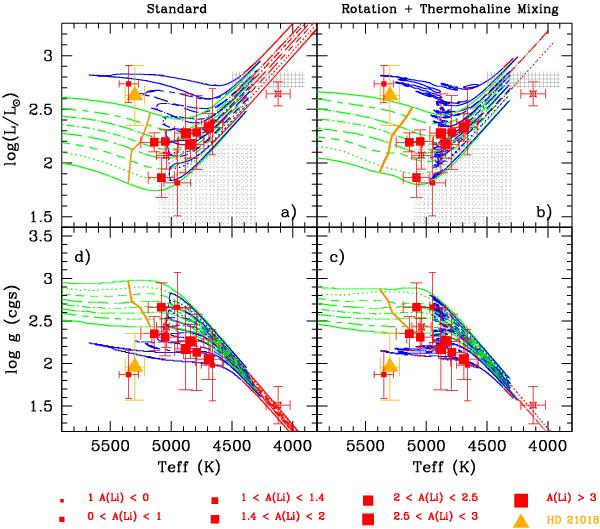
Weak G-band stars with the best parallaxes (error on the log(L/L⊙) lower than 0.5 dex) are plotted in the Hertzsprung-Russell diagram (upper panels) and in the (log g, Teff) plane (lower panels) along with evolutionary tracks for models with initial masses 3, 3.2, 3.4, 3.6, 3.8, 4.0, 4.2 and 4.5 M⊙ as described in Sect. 4 (from bottom to top in the HR diagrams and in the reverse way, from top to bottom, in the (log g, Teff) diagrams). Left panels represent classical models without rotation or diffusion processes, and right panels show models including rotation and thermohaline mixing. The bold line intersecting the racks on the left side of the plots marks the beginning of the first dredge-up. The size of the symbols is proportional to the Li content (the more lithium, the larger the symbol). Empty symbols are those for which no lithium abundance exists to date. The triangle in each of the plots represents star HD 21018, which is a spectroscopic binary. The shaded areas in the HR diagrams indicate the location of the Li-rich K giants, corresponding to the bump area for models with initial masses lower than 2.3 M⊙ and to the early-AGB phase for the models in the mass range presented here.
Current usage metrics show cumulative count of Article Views (full-text article views including HTML views, PDF and ePub downloads, according to the available data) and Abstracts Views on Vision4Press platform.
Data correspond to usage on the plateform after 2015. The current usage metrics is available 48-96 hours after online publication and is updated daily on week days.
Initial download of the metrics may take a while.