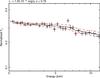
Fig. 14
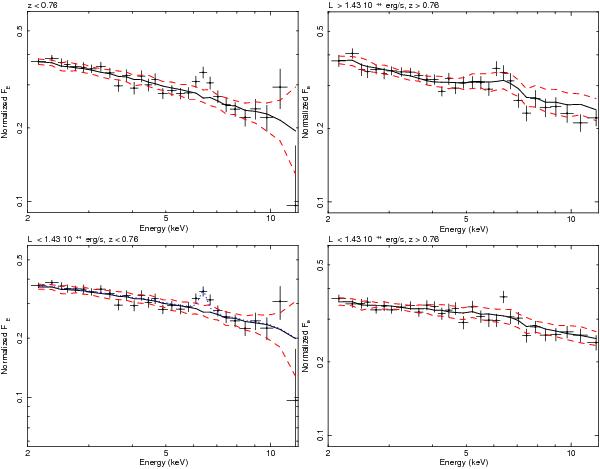
Average observed spectra (data points) of the L − z subsamples with their average simulated continua (continuous line) and the one-sigma confidence limits (dashed lines). For comparison, in the bottom-left panel we represent with a dotted line the result of adding to the simulated continuum a Gaussian centered at 6.4 keV, with σ = 120 eV, as obtained from the simulations of the Fe line (Sect. 3.3).
Current usage metrics show cumulative count of Article Views (full-text article views including HTML views, PDF and ePub downloads, according to the available data) and Abstracts Views on Vision4Press platform.
Data correspond to usage on the plateform after 2015. The current usage metrics is available 48-96 hours after online publication and is updated daily on week days.
Initial download of the metrics may take a while.