Fig. 4
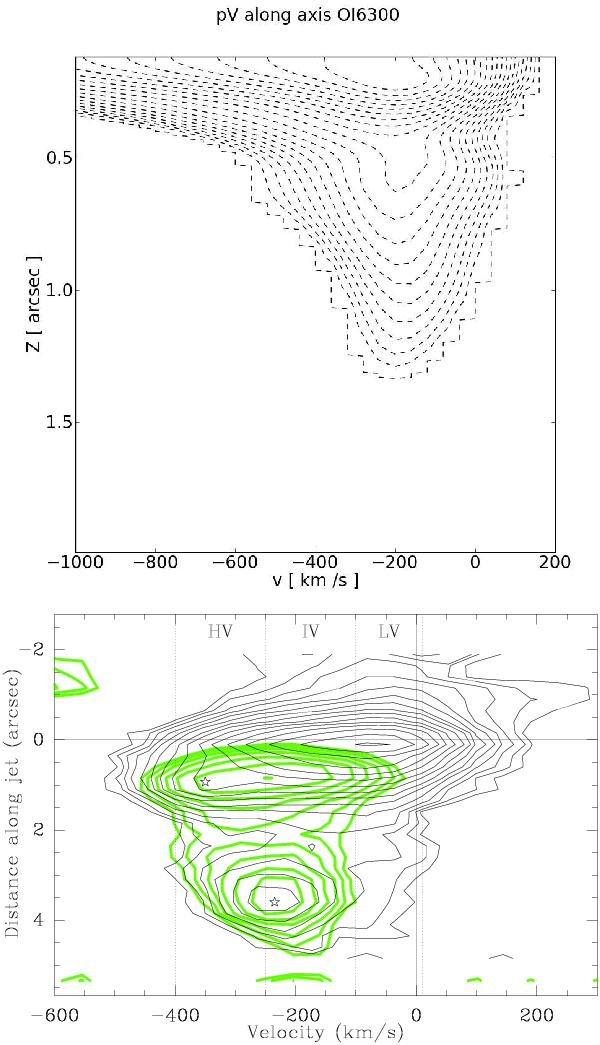
Top: synthetic position-velocity diagram of the [OI] λ6300 line for model SC1a, run (500, 1000, 0.8), and an inclination of 40°, where we assumed a distance to the jet of 150 pc. Bottom: observed position-velocity map of DG Tau for [OI] λ6300 (black thin lines) and [NII] λ6583 (green thick lines) from Lavalley-Fouquet et al. (2000). The dynamical range is similar in both plots.
Current usage metrics show cumulative count of Article Views (full-text article views including HTML views, PDF and ePub downloads, according to the available data) and Abstracts Views on Vision4Press platform.
Data correspond to usage on the plateform after 2015. The current usage metrics is available 48-96 hours after online publication and is updated daily on week days.
Initial download of the metrics may take a while.