Fig. 2
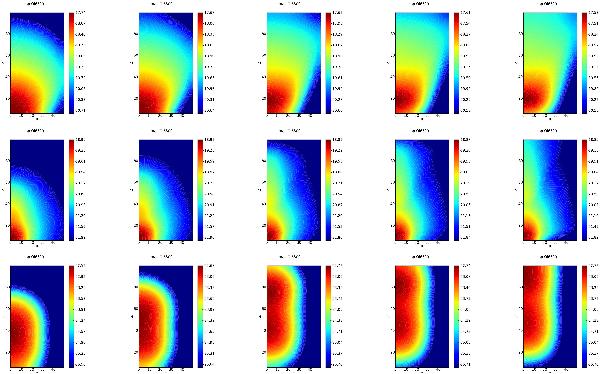
Synthetic emission maps of the [OI] λ6300 line, convolved with a Gaussian PSF with an FWHM of 15 AU, for run (500, 1000, 0.5) and the untruncated model ADO (top) and the model SC1a with outer truncation (middle) and for run (500, 100, 0.2) and model SC3 with inner truncation (bottom). The inclinations are 30°, 40°, 60°, 70°, and 90° (from left to right). The flux is in units of erg s-1 cm-2.
Current usage metrics show cumulative count of Article Views (full-text article views including HTML views, PDF and ePub downloads, according to the available data) and Abstracts Views on Vision4Press platform.
Data correspond to usage on the plateform after 2015. The current usage metrics is available 48-96 hours after online publication and is updated daily on week days.
Initial download of the metrics may take a while.