Fig. 3
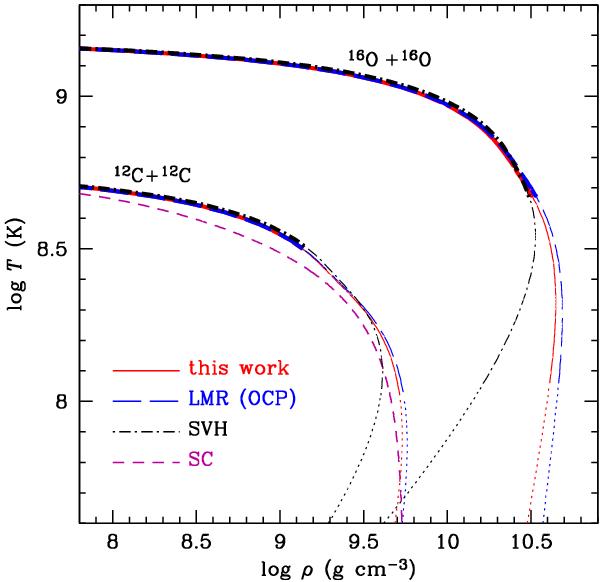
Ignition curves for carbon (lower/left group of lines) and oxygen (upper/right group of lines) in different approximations. Solid lines are obtained using Eq. (19) and the quantum correction according to Sect. 2.3; long-dashed lines: Eq. (12) and the quantum correction; dot-dashed lines: Eq. (18) without any correction. The lines are plotted heavy if the characteristic nuclear fuel burning time tburn is shorter than 1 Myr; the lines are plotted thin if 1 Myr < tburn < 14 Gyr. In the domain where tburn > 14 Gyr the lines are dotted. For the carbon case we also plot the fit (Potekhin et al. 2003) to the results of Sahrling & Chabrier (1998) (the short-dashed line).
Current usage metrics show cumulative count of Article Views (full-text article views including HTML views, PDF and ePub downloads, according to the available data) and Abstracts Views on Vision4Press platform.
Data correspond to usage on the plateform after 2015. The current usage metrics is available 48-96 hours after online publication and is updated daily on week days.
Initial download of the metrics may take a while.