Fig. 9
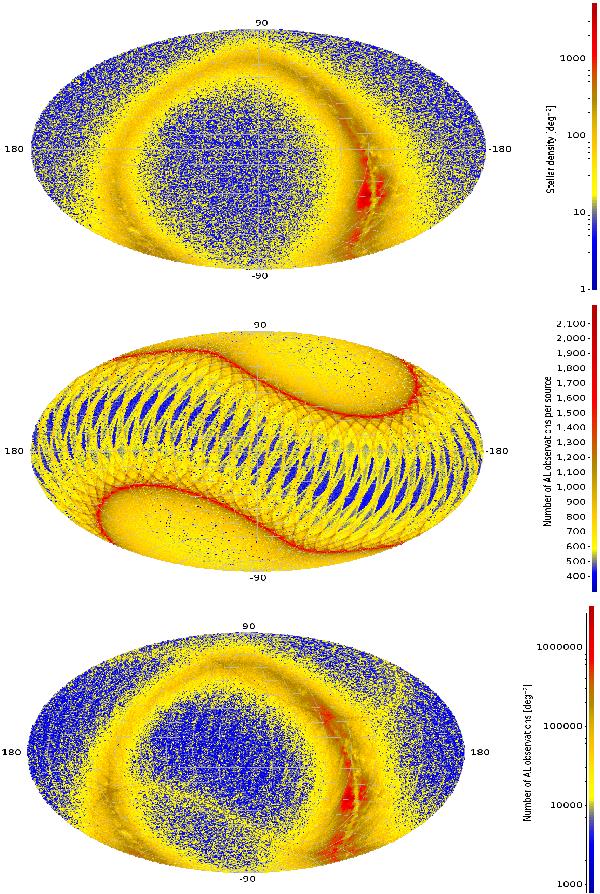
All-sky projections of (from top to bottom) the total stellar density in the input data to the demonstration solution, the number of AL observations per source, and the resulting spatial density of AL observations. These and all subsequent sky maps use the Hammer-Aitoff equal-area projection in equatorial coordinates, with α running from − 180° to + 180° right to left. Top: the simulated sky contains some 2 million single stars covering the Gaia magnitude range 6 ≤ G ≤ 20. The density ranges from less than 1 deg-2 around the galactic poles to a maximum of about 4800 deg-2 near the galactic centre in the bottom-right quadrant of the map. Middle: the number of along-scan observations per source reflects the scanning law of Gaia, which is roughly symmetric around the ecliptic plane and gives an over-abundance of observations at ecliptic latitudes ± 45°. Bottom: the combination of the source density and the scanning law gives the displayed density of along-scan observations.
Current usage metrics show cumulative count of Article Views (full-text article views including HTML views, PDF and ePub downloads, according to the available data) and Abstracts Views on Vision4Press platform.
Data correspond to usage on the plateform after 2015. The current usage metrics is available 48-96 hours after online publication and is updated daily on week days.
Initial download of the metrics may take a while.