Fig. 8
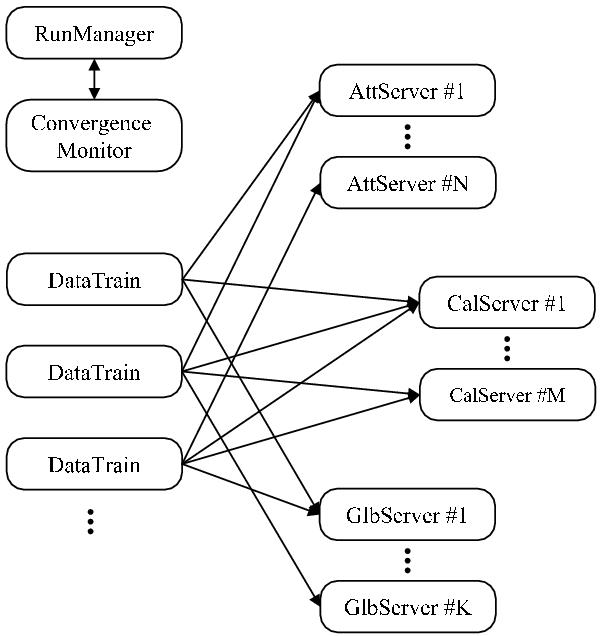
Simplified architectural design diagram of AGIS. The rounded boxes are independent Java processes running in parallel on different nodes of a multi-CPU processing cluster. The arrows indicate main data exchanges between the various processes. Input/output-related data flow from/to the storage system is not shown, and likewise some important but conceptually irrelevant interactions between some elements (e.g., the Servers and the RunManager).
Current usage metrics show cumulative count of Article Views (full-text article views including HTML views, PDF and ePub downloads, according to the available data) and Abstracts Views on Vision4Press platform.
Data correspond to usage on the plateform after 2015. The current usage metrics is available 48-96 hours after online publication and is updated daily on week days.
Initial download of the metrics may take a while.