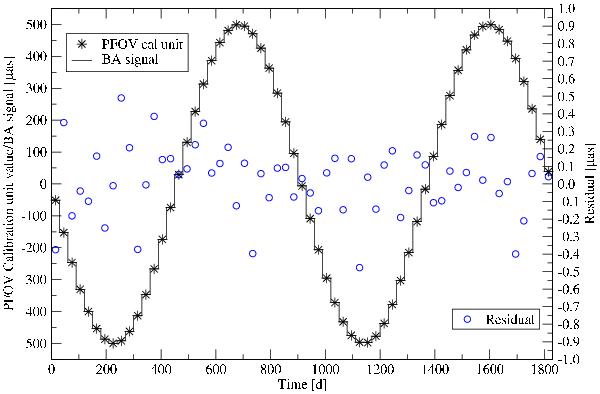
Fig. 15

Variation of the AL large-scale calibration parameters (averaged over all CCDs) in the preceding field of view (PFoV), as a function of the time since the beginning of the mission. The step-sinusoidal curve is the expected variation due to the simulated basic-angle variation having a period of 2.5 yr and an amplitude of 500 μas, but constant within each 30 day interval. The asterisks show the results of the solution (one value per 30 day interval), and the circles show the differences on the magnified scale to the right. Thanks to the constraint in Eq. (16), the mean calibration parameters in the following field of view (FFoV) exactly mirror the displayed ones, and are therefore not shown.
Current usage metrics show cumulative count of Article Views (full-text article views including HTML views, PDF and ePub downloads, according to the available data) and Abstracts Views on Vision4Press platform.
Data correspond to usage on the plateform after 2015. The current usage metrics is available 48-96 hours after online publication and is updated daily on week days.
Initial download of the metrics may take a while.


