Free Access
Fig. 14
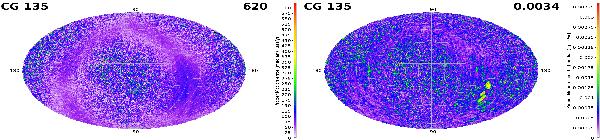
Maps of the error (left) and update (right) in proper motion for iteration 135. Each cell shows the colour-coded median error/update in units of μas yr-1, where the individual error/update is computed in terms of the equatorial components as  .
.
This figure is made of several images, please see below:
Current usage metrics show cumulative count of Article Views (full-text article views including HTML views, PDF and ePub downloads, according to the available data) and Abstracts Views on Vision4Press platform.
Data correspond to usage on the plateform after 2015. The current usage metrics is available 48-96 hours after online publication and is updated daily on week days.
Initial download of the metrics may take a while.