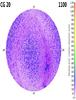
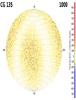
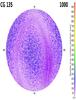
Fig. 12
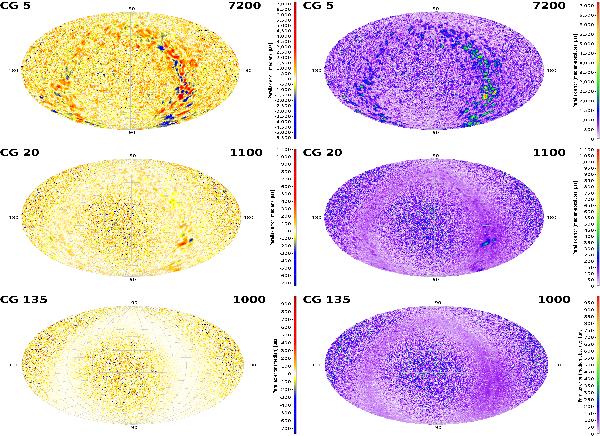
Maps (in equatorial coordinates) of the parallax errors in the three selected iterations k = 5, 20, 135 (top to bottom). The left column shows the median of the parallax error ϖ(k) − ϖtrue, while the right column shows the median of the absolute error |ϖ(k) − ϖtrue|; each map cell (of about 0.84 deg2) shows the colour-coded value computed for the sources located in that cell. Empty cells are shown in black. On every map plot the top left label indicates the iteration number and the top right label is the maximum value of the displayed range in μas. See text for further details.
Current usage metrics show cumulative count of Article Views (full-text article views including HTML views, PDF and ePub downloads, according to the available data) and Abstracts Views on Vision4Press platform.
Data correspond to usage on the plateform after 2015. The current usage metrics is available 48-96 hours after online publication and is updated daily on week days.
Initial download of the metrics may take a while.