Fig. 1
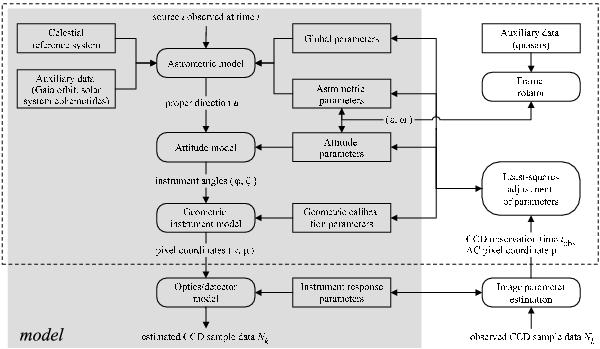
Schematic representation of the main elements of the astrometric data analysis. In the shaded area is the mathematical model that allows to calculate the position of the stellar image in pixel coordinates, and hence the expected CCD data, for any given set of model parameters. To the right are the processes that fit this model to the observed CCD data by adjusting the parameters in the rectangular boxes along the middle. This paper is primarily concerned with the geometrical part of the analysis contained in the dashed box. However, a brief outline of the CCD data modelling and processing (bottom part of the diagram) is given in Sect. 3.5 and Appendix D.2.
Current usage metrics show cumulative count of Article Views (full-text article views including HTML views, PDF and ePub downloads, according to the available data) and Abstracts Views on Vision4Press platform.
Data correspond to usage on the plateform after 2015. The current usage metrics is available 48-96 hours after online publication and is updated daily on week days.
Initial download of the metrics may take a while.