Fig. 7
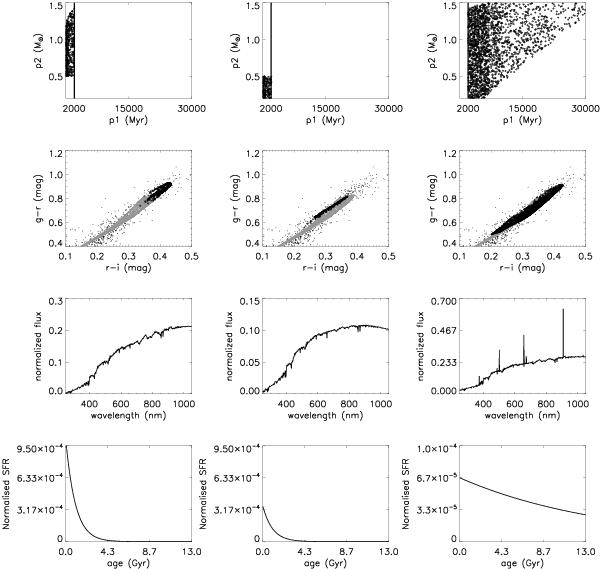
Investigation of the properties of synthetic early-type spectra, corresponding to the presence or not of emission lines and the SFR intensity. First row: the diagram of the p1 vs. p2 SFR parameters used to produce the early-type synthetic galaxy spectra for each selected group of spectra. The thick black line separates the non-emission line from the emission line spectra. Non-emission line spectra are represented by the points to the left of this line. Second row: the corresponding (g − r) − (r − i) color–color diagram of these spectra (dense area of black points) overplotted on the colors of the SDSS spectra (black dots) and the synthetic spiral spectra (dense area of gray points). Third row: the corresponding mean spectra that characterize each selected group of early-type galaxies. Fourth row: an example of the evolution of the SFR of one galaxy for each selected group.
Current usage metrics show cumulative count of Article Views (full-text article views including HTML views, PDF and ePub downloads, according to the available data) and Abstracts Views on Vision4Press platform.
Data correspond to usage on the plateform after 2015. The current usage metrics is available 48-96 hours after online publication and is updated daily on week days.
Initial download of the metrics may take a while.