Free Access
Fig. 3
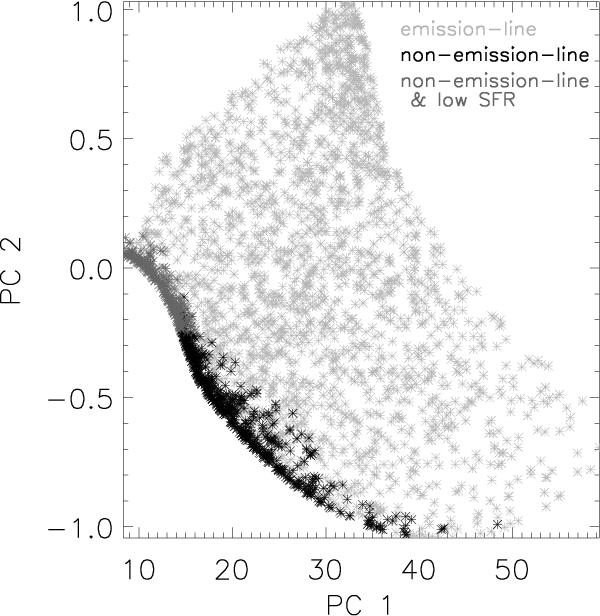
Projection of the early-type synthetic galaxy spectra on the first and the second principal components. Light gray points show emission-line spectra, black points show non-emission line spectra, while dark gray points show non-emission line low-SFR spectra.
Current usage metrics show cumulative count of Article Views (full-text article views including HTML views, PDF and ePub downloads, according to the available data) and Abstracts Views on Vision4Press platform.
Data correspond to usage on the plateform after 2015. The current usage metrics is available 48-96 hours after online publication and is updated daily on week days.
Initial download of the metrics may take a while.